


Article
How to Build a More Profitable Menu
Using Cost/Margin Analysis to Highlight your 'Prime' Menu Items
The menu may be the most important internal advertising device used to sell the customer once they are inside your restaurant. It is the only piece of printed "advertising" that you are virtually 100 percent sure will be read by the guest. Once placed in the guest's hand it can directly influence not only what they will order, but ultimately how much they will spend.
Using forecasted cover counts and average check targets, the menu design directly influences sales revenue. Management is constantly forecasting business volume and relating this knowledge to decisions on how much to buy, keep in inventory and prepare. The menu will have an effect on every one of these decisions.
More and more restaurant companies have come to realize and understand the importance of proper menu design on check averages. Several years ago, a popular casual-theme restaurant chain revamped its menu with the goal of increasing check averages. The menu was designed to lead the customer from the specialty drinks on the cover to appetizers on the first page to the complete dinners inside.
The old menu, by contrast, grouped multiple menu items next to one another on one large fold-out page. This, it was felt, might have somewhat deflected dinner sales by making it easy for the customer to select a lower-price appetizer instead of an entrée, which returned a higher check average.
An article in The Wall Street Journal reported how menus were being designed to highlight the most profitable offerings, which were also suggested by servers to guests who wanted their recommendation. Menus are being designed borrowing techniques from the retailing industry that make items stand out as if to say, "Buy me." Gallup conducted a survey that proved menu design had a "subtle effect" on what customers ordered. Using this knowledge, operators can boost sales of certain menu items.
In terms of time, Gallup reports that customers will read a menu for an average of 109 seconds. You have that long to get your message to them. The time limit needs to be addressed in your menu design and presentation. Some popular restaurant chains, T.G.I. Friday's for one, had a menu with over 12 pages at one time. It has since been reduced to six pages.
A properly designed menu can direct the attention of the diner to specific items and increase the likelihood that those items will be ordered. These items should be the ones with the highest gross profit, lowest food cost and help achieve the average check needed to return the desired sales. The customers' decision cannot be completely controlled; however, it can be directed and not left entirely to random chance selections.
That said, before you direct your guests to specific items, you need to know which items provide your restaurant the greatest return. We have examined menu analysis from a variety of perspectives, in past issues. In this article we explore "cost/margin analysis" and the benefits of this approach to determine the effect of various items on your profit-and-loss statement.
Why Gross Profit Analysis Can Sometimes Be Misleading
At one time, menu sales analysis has used either food cost percentage or item contribution margin (selling price minus food cost) to analyze the menu sales mix. Both perspectives included the popularity or number sold of each menu item to determine their respective effect on cost and gross profit (another name for contribution margin).
The food cost perspective reasons that it is better to sell the popular low food cost menu items. Each menu item is classified according to its popularity and food cost; e.g., it is either low cost and popular, high cost and popular, low cost and unpopular, high cost and unpopular.
The shortcoming of this view is that if you promote only the menu items with low food cost percentages, you will sacrifice sales revenue and your average check will drop because the items with the lowest food cost percentages, e.g., chicken and pasta, are also the lowest- priced entrées on the menu. Therefore, to increase overall revenue, more customers will have to be served. If customer counts remain constant and average check drops, total revenue will also fall and although you may see a drop in food cost percentage, your fixed cost percentages will rise (due to lower sales) and they will partially, if not totally, offset the decrease in food cost. Subsequently, the bottom line profit will not have improved.
Proponents of the "gross profit" approach, i.e., analyzing the value of menu items based on menu price minus food cost, completely ignore food cost percentage and concentrate on the amount of gross profit that is returned from the sale of a given menu item. Menu items are grouped into four categories according to their popularity and the amount of gross profit the menu items return. Menu items are therefore popular and high in gross profit; popular and low in gross profit; unpopular and high in gross profit; and unpopular and low in gross profit. If one concentrates on selling items that are popular and high in gross profit, treating food cost percentage as if it does not matter at all, will result in a rising food cost percentage.
While this works well in exclusive restaurants and country clubs where demand is relatively "inelastic" (meaning that you can raise prices significantly without losing sales) it fails when used in competitive markets and on market-driven menu items (items that are offered by most restaurants and which prices are kept in check by intense competition, e.g., hamburgers, barbecue ribs). In the latter case, when higher prices result in less demand, promoting the highest-priced items on the menu can cause demand to drop even though average check may increase. If customer counts are already flat or declining, this pricing philosophy will be ineffective. You will lose sales. (See "Questions to Consider When Pricing Your Menu" below).
Cost/Margin Analysis
Using "cost/margin analysis," every item on the menu is analyzed from three perspectives. Using the criteria of popularity (number sold) of each menu item, its respective food cost percentage and its total or "weighted" contribution margin, menu items are classified as either popular or unpopular, high or low in food cost, and high or low in contribution margin.
Cost/margin analysis particularly stresses that total contribution margin is much more important and relevant than the individual gross profit of a menu item. Building on the idea that you bank dollars, not percentages, the total gross profit dollars brought in by a popular menu item with a moderate individual gross profit will far exceed the total dollars from an unpopular menu item with a high individual gross profit.
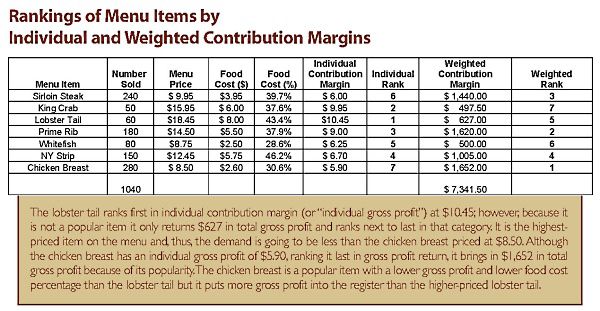
See "Rankings of Menu Items by Individual and Weighted Contributions Margins" below. The lobster tail ranks first in its individual contribution margin (or "individual gross profit") at $10.45. However, because it is not a popular item it only returns $627 in total gross profit and ranks next to last in that category. It is the highest-priced item on the menu so the demand will be less than the chicken breast priced at $8.50. Although the chicken breast has an individual gross profit of $5.90, ranking it last in gross profit return, it brings in $1,652 in gross profit because of its popularity. The chicken breast is a popular item with a lower gross profit and lower food cost percentage than the lobster tail but it puts more "gross profit" into the register than the higher-priced lobster tail.
Using the combined criteria of popularity (number sold), the item food cost percentage, and the weighted contribution margin (as opposed to the individual contribution margin used in the gross profit approach) for each menu item, cost/margin analysis classifies each menu item into one of four categories called "Primes," "Problems," "Standards" and "Sleepers" (see "Classifications of Menu Items" below.)
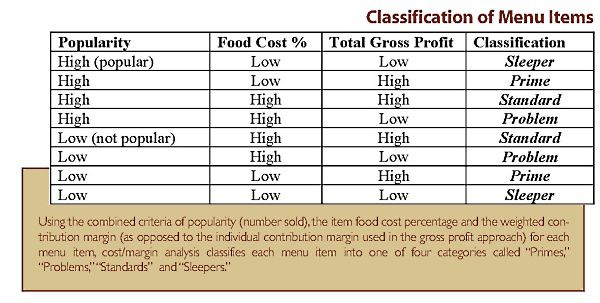
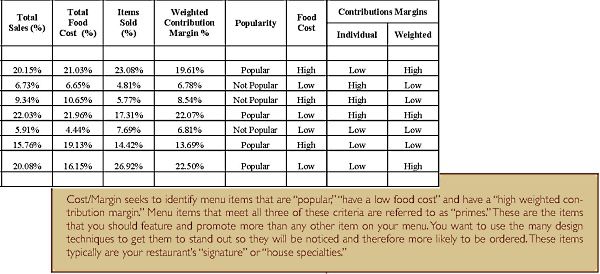
Cost/margin seeks to identify menu items that are "popular," "have a low food cost" and have a "high weighted contribution margin." Menu items that meet all three of these criteria are referred to as "primes." These are the items that you should feature and promote more than any other menu items on your menu. You want to use the menu design techniques to get them to stand out so they will be noticed and therefore more likely to be ordered. These items typically are your restaurant's "signature" or "house specialties."
Primes are popular menu items that have a low food cost and contribute a high contribution margin. These items are given the greatest emphasis on the menu to increase their sales. The more items in this quadrant, the better the sales mix will result in lowering food cost percentage and increasing the weighted contribution margin.
Standards are popular menu items with high contribution margins and high food costs. These often are the steaks and seafood entrees on the menu. Sleepers are unpopular menu items with low contribution margins and low food cost percentages. Finally, the problems are unpopular menu items that are high in food cost and low in contribution margin.
Strategies to Improve the Mix
Operators have long sought a method for analyzing a menu sales mix to determine the effect each item has on the resulting sales, costs and profits. Operators who have costs and waste under control must look to the menu sales mix as possible causes for lost sales revenues and profits. Certain items on the menu need to be aggressively promoted while others need to be de-emphasized or dropped from the menu. The perspective from which these items are analyzed will greatly effect the ultimate action taken.
Once items are classified into one of the four categories, different strategies are employed that will help improve the overall sales mix. The strategies used involve menu design, menu pricing and marketing methodology.
Remember that it is not possible to have all menu items in the "primes" quadrant and a menu will generally contain a mix of problems, sleepers and standards.
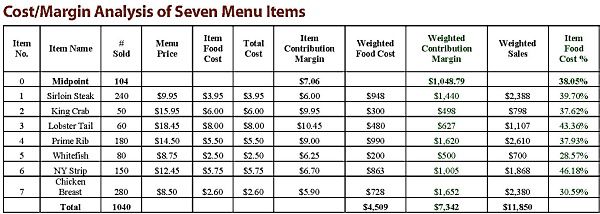
To best see where items fall in this matrix, convert the data into an XY axis chart. To start, see the chart "Cost/Margin Analysis of Seven Menu Items", and the XY graph of that data below.

Again, items in the upper right quadrant are high in food cost and high in contribution margin and are "standards." They are called that because most of the items are traditional items found on most table- service menus, e.g., steaks, prime rib, lobster and other seafood.
They are usually the highest-priced items on the menu and have the highest food cost percentages. All menus need to have standards to "balance" the menu with items that help raise the average check.
Items to the lower left are the "sleepers" because they are low in food cost and low in weighted contribution margin. The reason they are low in contribution margin is because they are unpopular items. Every restaurant needs to test new dishes to keep their menu fresh and will often add low food cost items at low prices to create some demand. The inclusion of sleepers in the sales mix helps "soften" the negative higher-than-average food costs of "problems" and "standards."
In the upper left quadrant are the "problems," again, called so because they are high in food cost and low in contribution margins. Often many of the items falling in this quadrant are children's menu items and desserts. Children's menu items are often priced at cost, and in some operations children eat free. This is a marketing-based pricing strategy and these items must be viewed differently from ordinary menu items during cost analysis. Typically, they make up such a small percentage of the total food cost or sales revenue that they have an insignificant effect on the overall figures.
Computers Don't Replace Good Judgment
It is important to point out that decisions on how to deal with problems are not made solely on quantitative data. If that were the case, a computer program could replace management when it comes to adding or deleting items from the menu. There are many nonquantifiable factors that must be included in menu planning and pricing decisions. Tradition, company policy, customer preferences, regional practices, competition and marketing policies are all important factors that will override purely quantitative factors and keep certain items on the menu regardless of costs or contribution margins.
The menu items falling closest to the intersecting lines are the easiest to improve or strengthen. Small changes in price and cost, menu positioning to increase selection, and the addition or deletion of accompaniments or portions can make an item either a better value to the customer or reduce the food cost, thus moving the item downward and to the right in the graph.
Questions to Consider When Pricing Your Menu
The following is a checklist of questions you should consider when pricing a menu item. Many of the questions are subjective rather than objective but just the same, will affect the price you can charge on your menu. Customers will come in with "reference" prices that they expect to pay for certain items and will not think twice about paying $1.50 for a glass of iced tea that has a cost of about a nickel, and complain if they feel that the price you are charging for chicken tenders or a hamburger is perceived as too high. If the item is on your appetizer menu, you might have more pricing latitude than if the same item is served as an entrée. For example, consider a shrimp cocktail with six shrimp for $5.95. Would you purchase the same dish as an entrée for the same amount?
Each menu item will be marked up individually and produce a range of food cost percentage from single digits to the high 40s. Remember, it is the sales mix of all the menu items that produces the food cost that shows up on your monthly income statement.
- What kind of menu item is it, e.g., appetizer, entrée, dessert, side dish?
- What is the direct labor involved in its preparation?
- Does it require skilled preparation or just simple heating and plating?
- What is the portion size?
- Is it a seasonal item with limited availability?
- What are competitors charging for similar menu items?
- Is it a "commodity" or a "specialty" item on your menu?
- What is the desired food cost percentage?
- Is it a demand-driven or market-driven menu item?
- What kind of restaurant are you, e.g., fast-food, fast-casual, limited-service, fine-dining?
- What meal period are we pricing it for, e.g., breakfast, lunch, dinner?
- Where is the restaurant, e.g., center city, suburban, office building, resort area?
- What are the accompaniments served with it?
- Who is your target market or clientele, e.g., local residents, tourists, business people, shoppers?
- What is the perish ability of the product and its cost, e.g., live lobster, fresh seafood?
- What is the service delivery method in the restaurant, e.g., table- service, self-service, drive-through?
- What is the check average you seek?
- What are the prices of other menu items in the same menu category and the spread among items in other categories?
- What are the prices of complimentary and competing items on the menu?
- What is the ambience of the restaurant?
- What is the plate presentation for the menu item?
- Is there live entertainment or music in the restaurant?
- What is the status of the restaurant in the market? Is it one of the top restaurants in the market?


