

Survey
Restaurant Occupancy Cost
In a recent Discussion Forum topic, members were inquiring as to how much lease space cost in various parts of the country.
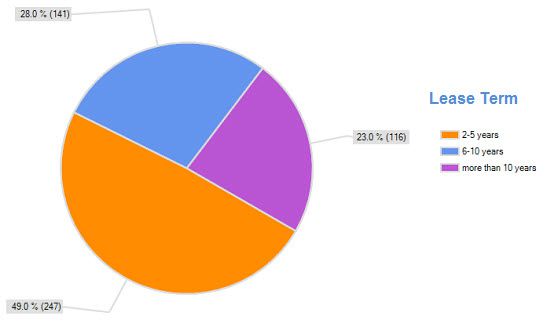
In our continuing effort to provide helpful data to our members, we conducted a survey in which we asked our members to share how much they were paying for base rent. percentage rent and triple net charges. We received more than 550 responses and have compiled the following reports as to the cost per square foot for a sampling of restaurants across the country.
The report below shows the collective responses for all respondents. While this information is beneficial, more meaningful comparisons can be made by reviewing the results of only those restaurants that more closely resemble your own concept.
| To help you, we have filtered the responses and prepared summary reports for the following areas: | |
|---|---|
| Population - City | |
| Geographic region (which part of the USA) | |
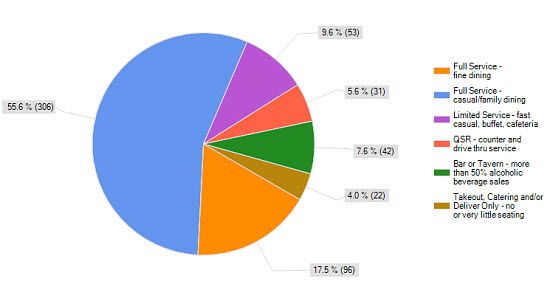
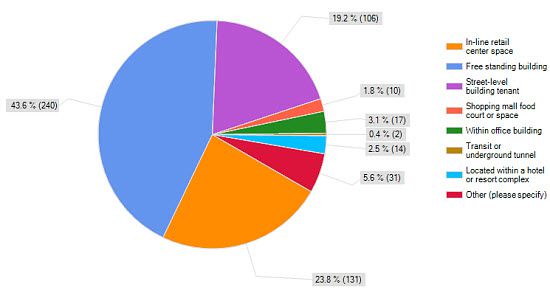
| Type of lease space (Free-standing, strip center, mall, etc.) | |
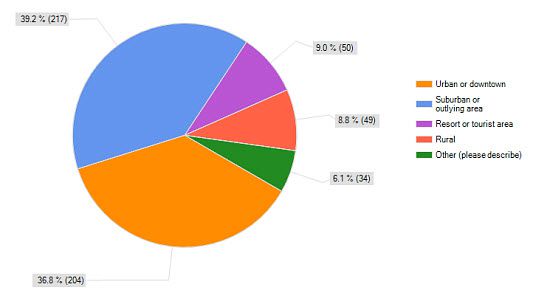
| Surrounding market (Urban, sub-urban, resort, etc.) | |
| Survey Summary - All Respondents | |||||
| Base Rent | Lower Quartile | Median | Upper Quartile | Average | # of Respondents |
| Monthly base rent | $3,000 | $5,000 | $8,750 | $6,914 | 496 |
| Square footage of restaurant | 2,100 | 3,500 | 5,000 | 4,180 | 496 |
| Base rent per sq. ft. - monthly | $1.00 | $1.50 | $2.22 | $1.95 | 496 |
| Base rent per sq. ft. - annual | $12.00 | $18.00 | $26.64 | $23.39 | 496 |
| Percentage Rent Paid | % of Respondents | # of Respondents | |||
| 1-4% of sales | 6.9% | 35 | |||
| 5% of sales | 4.6% | 23 | |||
| 6% of sales | 4.4% | 22 | |||
| 7% of sales | 3.8% | 19 | |||
| 8% of sales | 2.6% | 13 | |||
| 9% of sales | 2.0% | 10 | |||
| 10% of sales | 2.4% | 12 | |||
| More than 10% of sales | 3.0% | 15 | |||
| Do not pay percentage rent | 70.4% | 355 | |||
| Triple Net Charges | Lower Quartile | Median | Upper Quartile | Average | # of Respondents |
| Per sq. ft. - monthly | $0.10 | $0.26 | $0.50 | $0.44 | 360 |
| Per sq. ft. - annual | $1.21 | $3.08 | $5.95 | $1024 | 360 |
| Total annual expense | $4,000 | $10,000 | $25,000 | $19,167 | 360 |
Additional resources to help you manage and gauge the financial impact of your occupancy cost:
-

Article
Your Landlord Doesn't Want to Re-Lease Your Space: How to Renegotiate Your Lease
Well, things aren't looking good. Staff is at a minimum, inventory is threadbare, and marketing has gone down the drain. Revenue plots illustrate an ominous downhill turn for the worse. What do you do ...
-
Article
Restaurant Rules of Thumb: How Does Your Operation Measure Up to Industry Averages & Standards?
A review of several key restaurant industry startup, financial & operational metrics that have proven to be reliable measurements over time. A handy guide for operators planning changes or assessing ...